How Do I Set Breakpoints in the Application? (Magic xpa 3.x)
In order to view what is going on during a program while it is running, you will set breakpoints. There are three different kinds of breakpoints available:
Each of these are useful in different ways, and are described below.
You set breakpoints within the Magic xpa Studio. Whenever the debugger encounters a breakpoint, it will pause. Once the debugger is paused, you can view the variables, call stack, and contexts. Then, you can choose to continue, or step through the code.
To set a breakpoint:
-
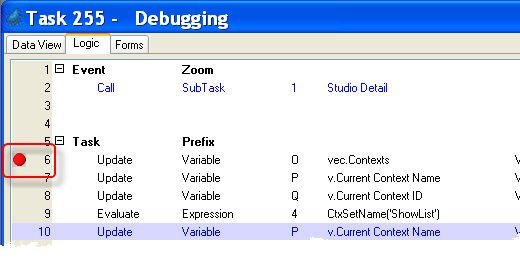
Go to the operation you want to break on.
-
Press F9 (Debug->Toggle breakpoint).
You can turn off the breakpoint by pressing F9 again while positioned on that operation. However, you can also turn off a breakpoint by deleting it from the breakpoint pane. This is a convenient way to turn off all the breakpoints when you are finished debugging.
You can set breakpoints while your program is running. The program will open in read-only mode, so you can’t change the actual program, but you can add and delete breakpoints.
In addition, you can modify the operation of the breakpoint in the breakpoint pane, as shown below
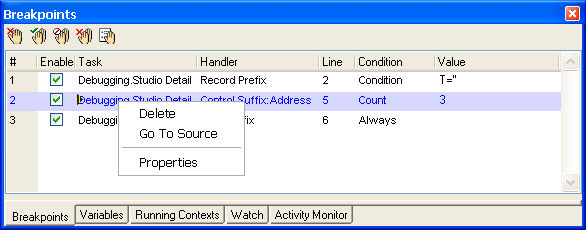
Whatever breakpoints you set will show up in the Breakpoint pane. Here you can modify them in several ways. You can:
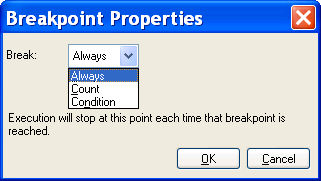
In addition, you can fine-tune when breakpoints happen by using the breakpoint Properties.
-
Position the cursor on the breakpoint you want to modify.
-
Select right-click->Properties (or  , or Alt+Enter). The Breakpoint Properties will appear.
-
For the Break field, select Always, Count, or Condition.
-
If you select Always, there is nothing else to do.
-
If you select Count, enter the number of iterations you want to pause on. For instance, if you have a process that will loop 1,000 times, you can set the count to 300, and it will only start pausing after the first 300 iterations.
-
If you select Condition, you can zoom to the Expression editor to enter a condition that will evaluate to True or False. The breakpoint will break if the condition evaluates to True.
Another useful thing you can do from the Breakpoints pane is to select right-click->Go to source. This will position you directly on the breakpoint in the Studio.
If you set a breakpoint on any variable in the Data View, then the Debugger will pause whenever the value of that variable changes.
To set a Data Change breakpoint:
-
Go to the operation you want to break on.
-
Press F9 (Debug->Toggle breakpoint).
The Data Change breakpoints are handled on the Breakpoint list as described for breakpoints on operations.
It is also useful to have a shorter list of variables you are keeping an eye one. You can add variables to the Watch List. Then when you pause on your Data Change break, you can see how they changed. To add a watch on a variable:
-
In the Studio, position the cursor on the variable (Column or Virtual)
-
Select Debug->Add to watch or right-click->Add to watch.
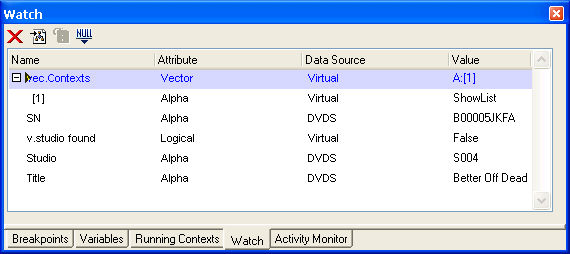
You won’t see a red dot next to the variable as you do with a breakpoint, but you will see the variable listed in the Watch pane. The variables in the Watch pane are also visible on the Variables pane, but you can see them more conveniently.
From the Watch pane, you can:
-
Turn off the watch by deleting the Watch entry (click on the  , or press F3, or select right-click->Delete).
-
Set the value of the variable to some other value (right-click->Set data, or select  ).
).
-
Set the value of the variable to Null, if allowed (right-click->Set null to data, or select  ).
).
-
Jump to the variable in the source code (right-click->Go to source, or select  ).
).
Even if you don’t have any breakpoints or watches set, you can use Break Now to view the variables and call stacks whenever you like. This is particularly useful in online programs, where you might be working with the program and testing it, and then suddenly get a result you were not expecting. Since the variables, contexts, and call stack are only visible during a breakpoint, this using Break Now allows you to view those items.
To use Break Now:
-
Switch to the Studio window.
-
Press Alt+Ctrl+F7 (Debug->Break Now, or press the  on the toolbar).
The debugger will pause in the same way it does during a breakpoint or watch.
