Data Grid Dashboard (Magic xpi 4.13)
When you click on the Data Grid button on the side navigation bar, the Data Grid Dashboard opens. This provides detailed information about the GigaSpaces entities running on your cluster.
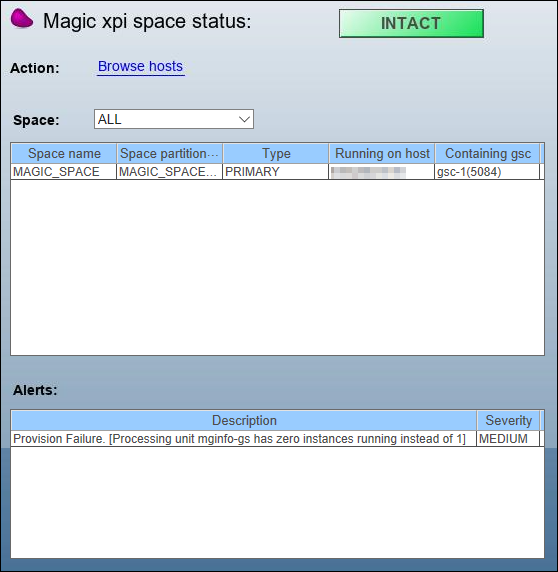
This dashboard displays the following top-level information:
-
Space status
-
Space partitions distribution: This can be filtered using the drop-down list.
-
Space-related alerts: The Space alert definitions and thresholds are loaded from: Runtime\Gigaspaces\config\alerts\alerts.xml (Since version: 4.5). The available Space alerts can be found at: http://docs.gigaspaces.com/xap97/administrative-alerts.html.
You navigate to the Hosts window by clicking Browse hosts in the Data Grid Dashboard.
This window contains a list of grid hosts as well as the following data grid summary:
-
IP Address
-
CPU Utilization
-
Memory Utilization
There is also the following detailed information about the data grid:
-
Grid Components tab:
-
-
Name: The grid component name (GSC1, LUS2, etc).
-
Type: GSC, GSM, LUS, or GSA.
-
PID: The process ID of the grid component.
-
Zones: A comma delimited list of zones that the grid component belong to.
-
Used Memory (MB): The grid component's memory usage.
-
Used CPU (%): The grid component's CPU usage.
-
Magic Engines tab:
-
-
Name: The engine's name.
-
Type: Magic xpi or Magic xpa.
-
PID: The process ID of the engine.
-
Project/Application Name: The name of the project or application that the engine is handling.
